
This page covers my latest TA thoughts on Bitcoin. I cover intraday movements, TA, and other crypto thoughts in Discord, join from the Discord box on the right if interested. Here is the 2022 Bitcoin Analysis.
April 3rd, 2023 – Quick Hit – RSI Triangle!
$BTCUSD – The first concerning thing from the day timeframe from a LONG perspective is yesterday we have a triangle RD RSI signal and pattern that has formed. Unless answered by a green candle counter RSI signal (most likely on the slow momentum check) we’d expect 60m SHORT bias and momentum to hold. Weekly open within sight of being lost with 240 RDA as the next reaction zone. It should be clear based on the RDTS how to trade this, also verify via 4D:
March 2023 TA
We go all in with Bitcoin TA and look to see what the chart tells us. The RexDog Trade System is providing very clear levels and analysis for us to trade around. We’ve added to key levels to the chart available to members. The current daily chart is BIAS short and MOMENTUM long. The 4D chart is BIAS short and MOMENTUM long. I also mention in this video that by the end of day it might be trying to recapture the weekly open.
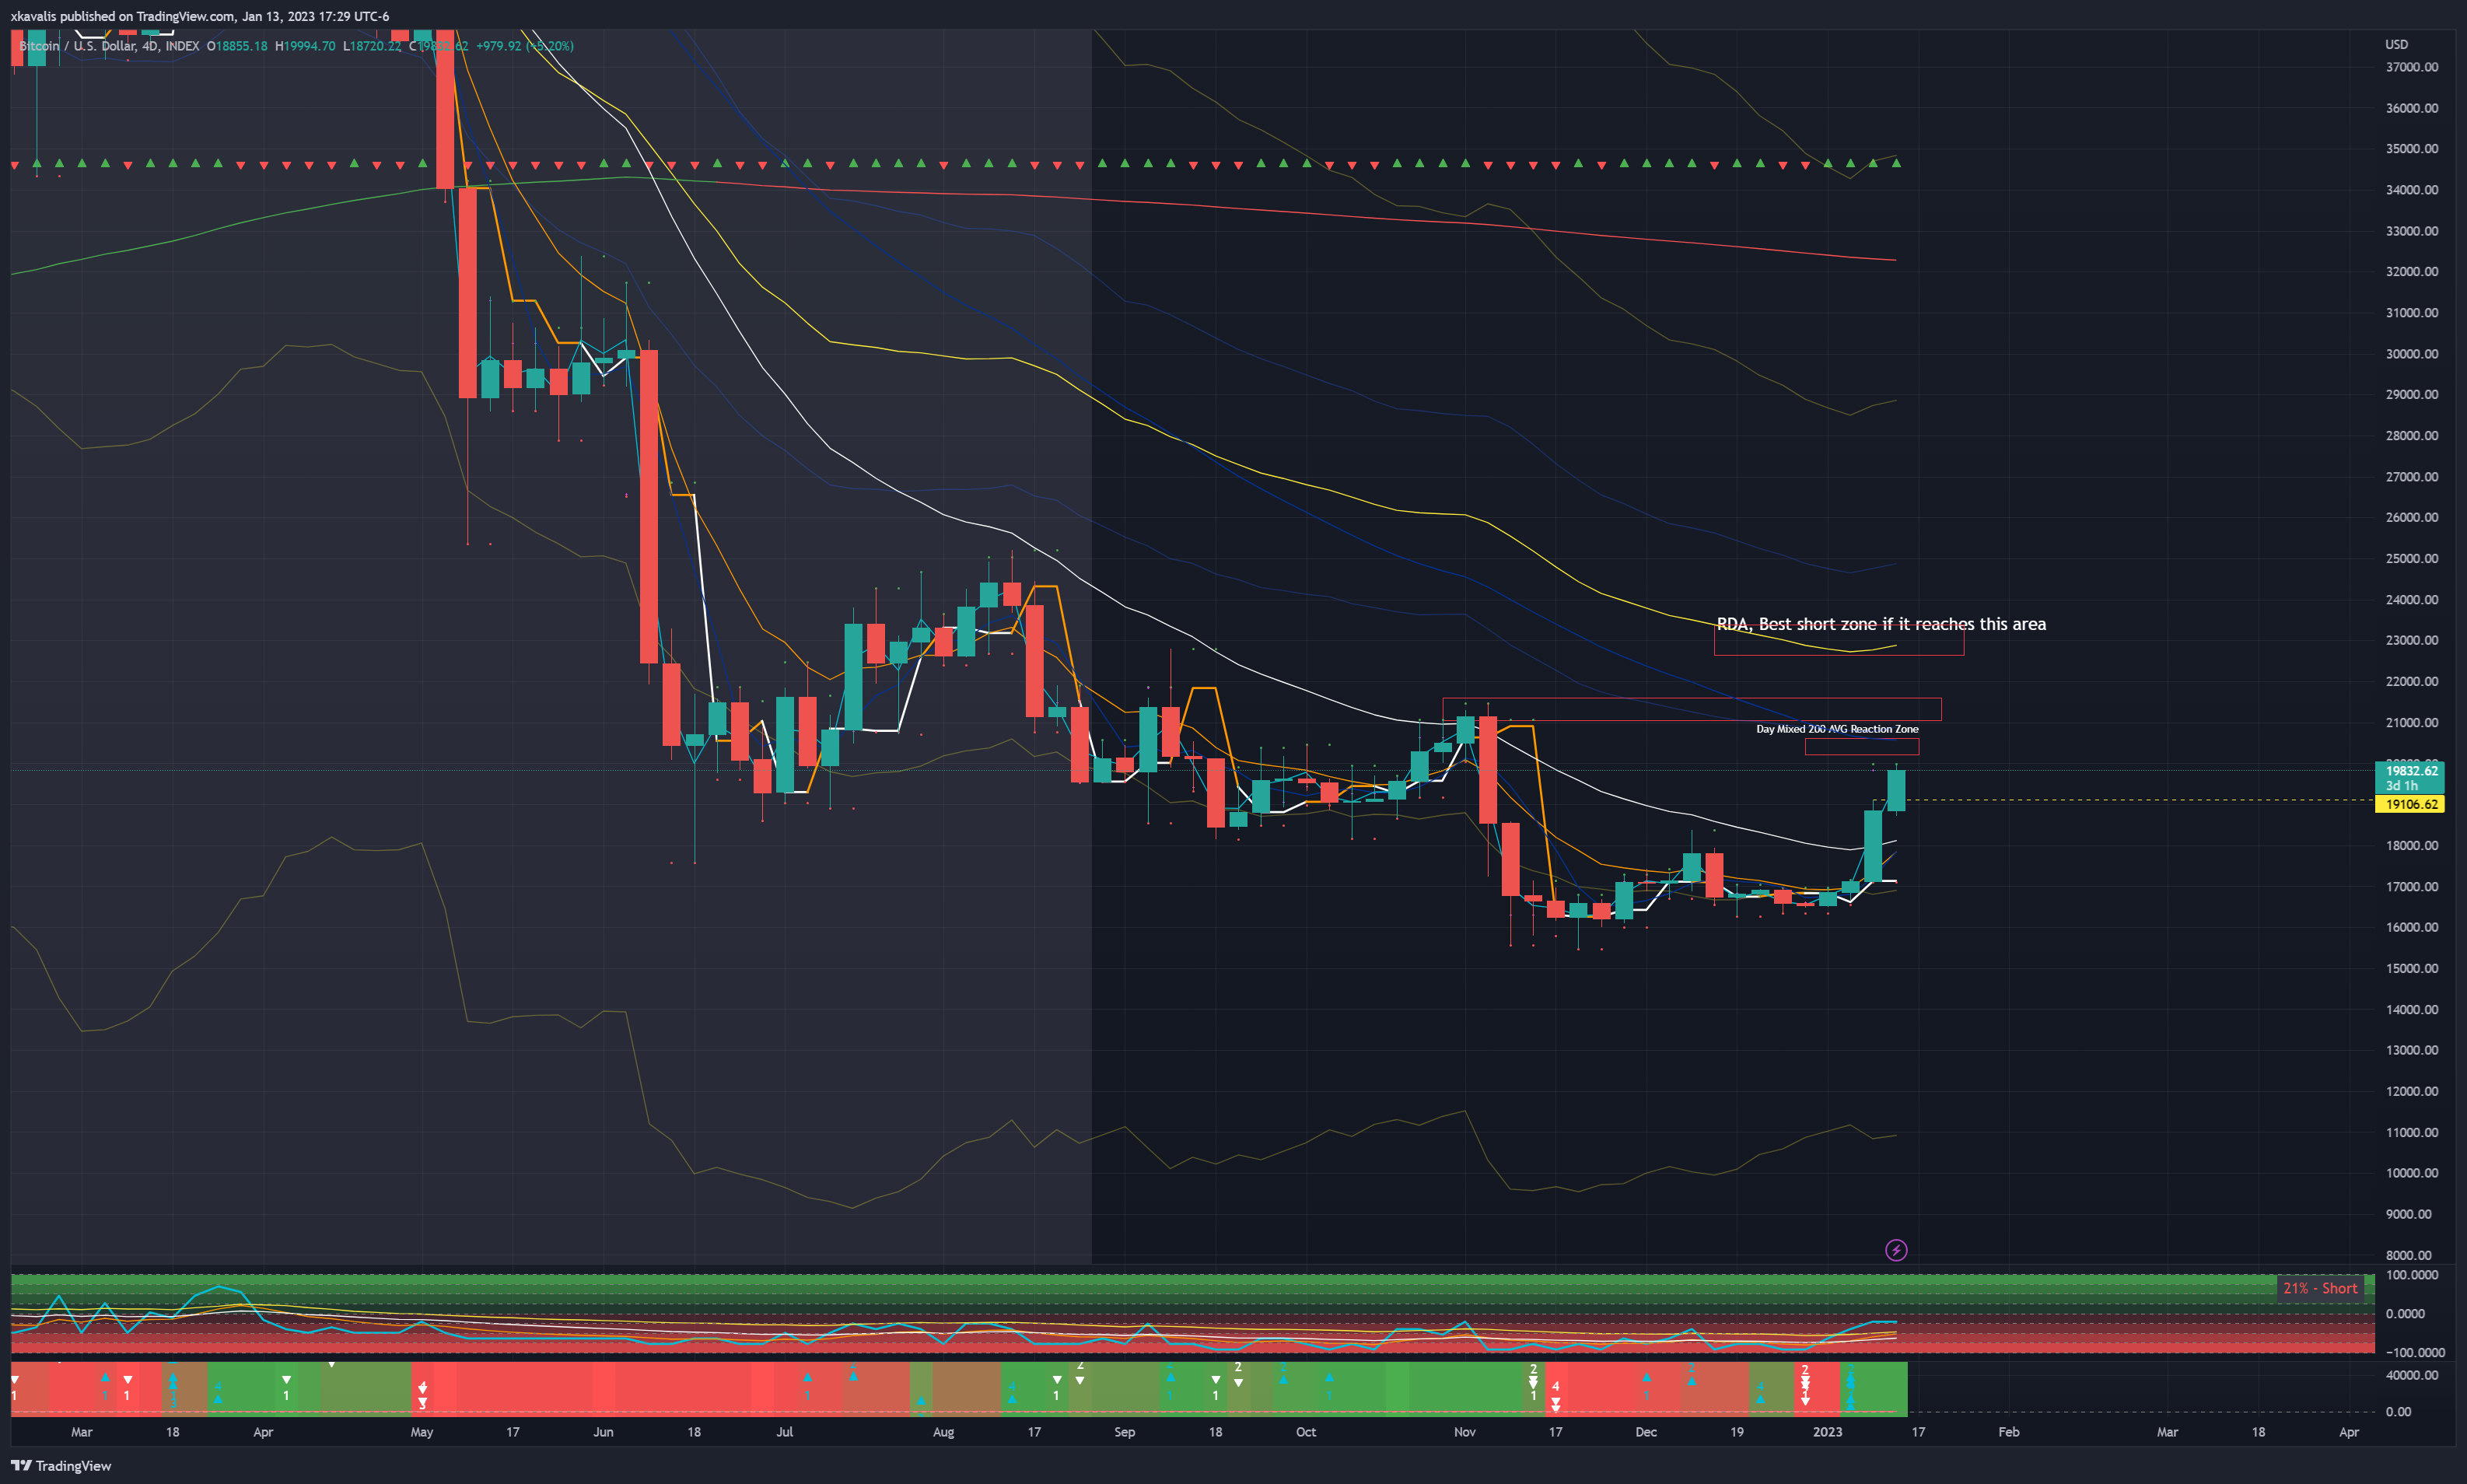
Mid JAN Momentum Move
Obvious key reaction areas to watch.
* one thing to note, the DAY chart is approaching the mixed 200 avg . So I’d expect a reaction around this zone of from 20,100 – 21,600 or so.
From there, we have two obvious reaction areas that anybody who trades my highly effective trading system:
- 20,187 or so – 4D key reaction level. Follow the rules outlined when trading around reaction levels and PACs
- RDA – 22,500 to 23,400 – 4D RDA, if the price gets here, this is the best highest probable short area for a SHORT FADE swing trade on Bitcoin .
I use these charts to define zones, then I drop down to 30m structure chart to confirm a FADE move. From there I typically watch the 5m and TICK charts to confirm an early change in bias. Then on confirmation of a 30m bias change I add at size on key reaction areas.
That’s it. Question leave them below and I’ll answer, even provide TA.
End of Year 2022 and Beyond
In this video we cover TA for Bitcoin going into the 2022 year end and beyond. First up I’ll share the link to the Bitcoin Analysis Series that covers both the 1st, 2nd, and the current 3rd crisis of Bitcoin, that can be found here: Free Bitcoin 3rd Crisis Content.
In this video we cover a few interesting things about Bitcoin and where it’s at on the chart.
The first thing is BTC has left the 150D value channel to create what is most likely going to be a lower VC. I go over some key levels to watch and how it already tested a major inflection area.
We then dive into how BTC has given up every single aVWAP of significant highs and lows since the mass awareness.
There is one important development that might change the whole narrative on what Bitcoin does next… for those have been with me since the early days they will clearly note what we always look for in a sell off– stopping volume. We do see evidence of stopping volume. I actually show the most recent examples of what happened after we last saw stopping volume.
From there we go left of the chart and see if we can find clues where Bitcoin might be headed as we end the year 2022 and beyond. Factors that play a role is the previous VC, key levels, 4D chart, and momentum and bias indicators.