
Introducing the Multi-Day vWAP indicator that is fully customizable with average indicator option.
This indicator on default plots the last 10 days of vWAPs. An awesome indicator to measure bias and dare I say it… trend– no we don’t use tthat here, momentum is what it measures.
TradingView Link
Multi Day vWAP (Customizable) with Average
Video Tutorial
How This Works
High level overview (default settings):
- Default is 10 plots with each setting 1 day apart (1-10 day look back)
- Labels for each plot are turned on by default (labels will default to your value, more below)
- Use Style tab in options to change colors, plot style, and turn on/off individual plots
- Average is turned off by default (style panel will show it’s on– go to Inputs panel and select “Show vWAP Average” to turn on)
- Best use case is go to Visibility Panel in options and turn off for Days, Weeks, and Months
- To turn off all labels at once go to Style tab and unselect “Labels” checkbox
- If you want plots to be as small as possible in Inputs panel set the Plot Width to 0 (zero)
Detail Overview
This indicator will plot your custom daily vWAP values.
You can change the lookback period. If you change the lookback period the label will match your custom value.
For instance, if you change vWAP 1 value to “5”, the label for this plot will be 5.
Average Notes:
- The average will average all the vWAP values by the divisor. The default is to average all values by 10.
- The average will always start to plot from the shortest lookback period. It is not possible to have the average plot before that point.
Trading Tips (default settings)
The simple way to use the vWAP is to treat them as magnets.
For instance,
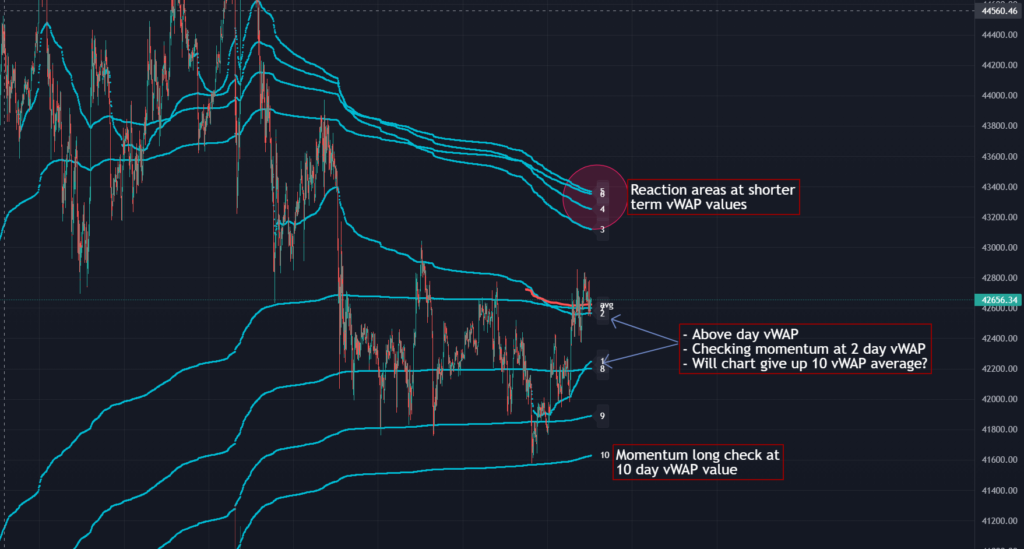
Generally if price is trading below all the vWAP plots the chart is in a momentum short environment. All vWAP areas can be used for upside resistance/reaction areas.
If price is trading above the chart is in a momentum long environment and pullbacks can to vWAP levels can be looked as areas of support/reaction.
Price is above the current day vWAP and looking to test the previous day vWAP value.
As it approaches the 2 value you are expecting this area to be a reaction area (good trade entry area) for a continuation short trade. Possibly to check back into the current day vWAP value.
I should share that this is a simple way to trade with the vWAP (true success with vWAP is understanding that price trades in vWAP channels).
Stacking and Strong Momentum
The other pattern you should look for is stacking.
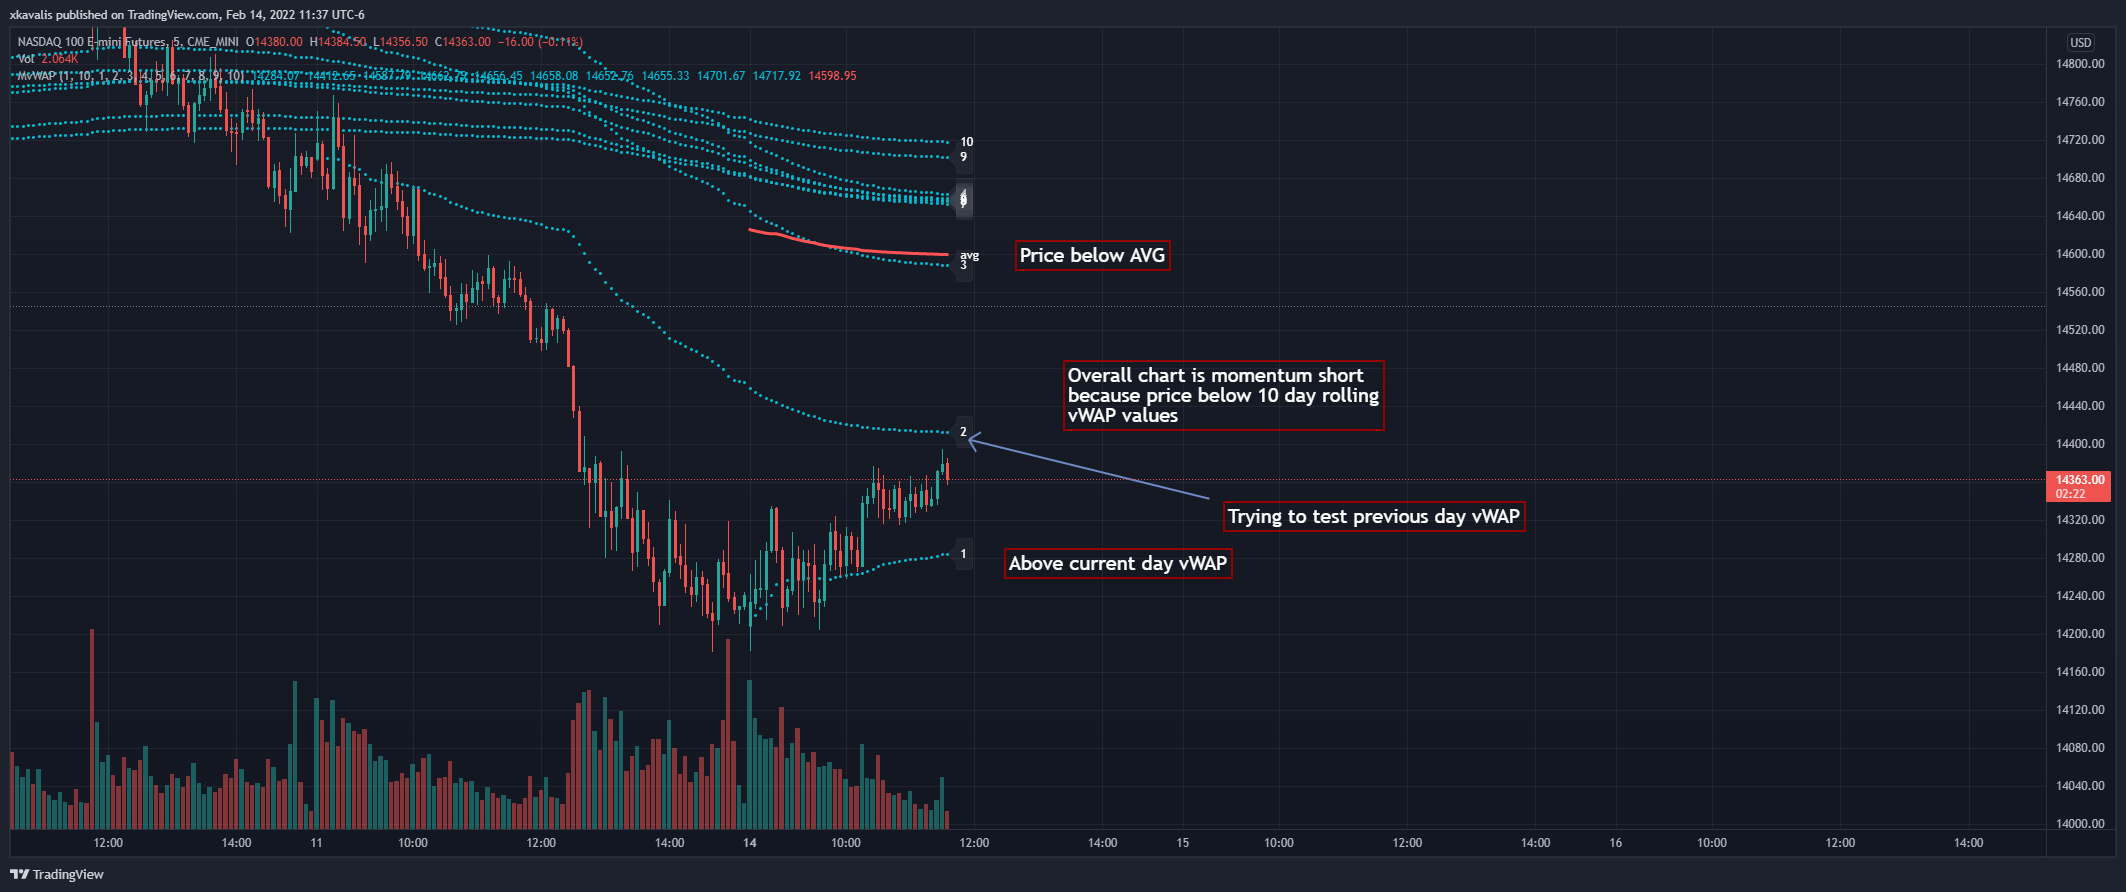
For instance on this CL chart:
This chart is strong momentum long.
All 10 day vWAP plots are stacked on top of each other.
Previous action tested below all vWAPs. Price traded thru and came back and retested. Finally closing above all and above the vWAP avearge (red).
When the day vWAP was broke the next target you look for is the 2 vWAP . This reaction area held up and momentum long continued and continuing to trade above current day vWAP .
7 Day Rolling Example (Larger Timeframe)
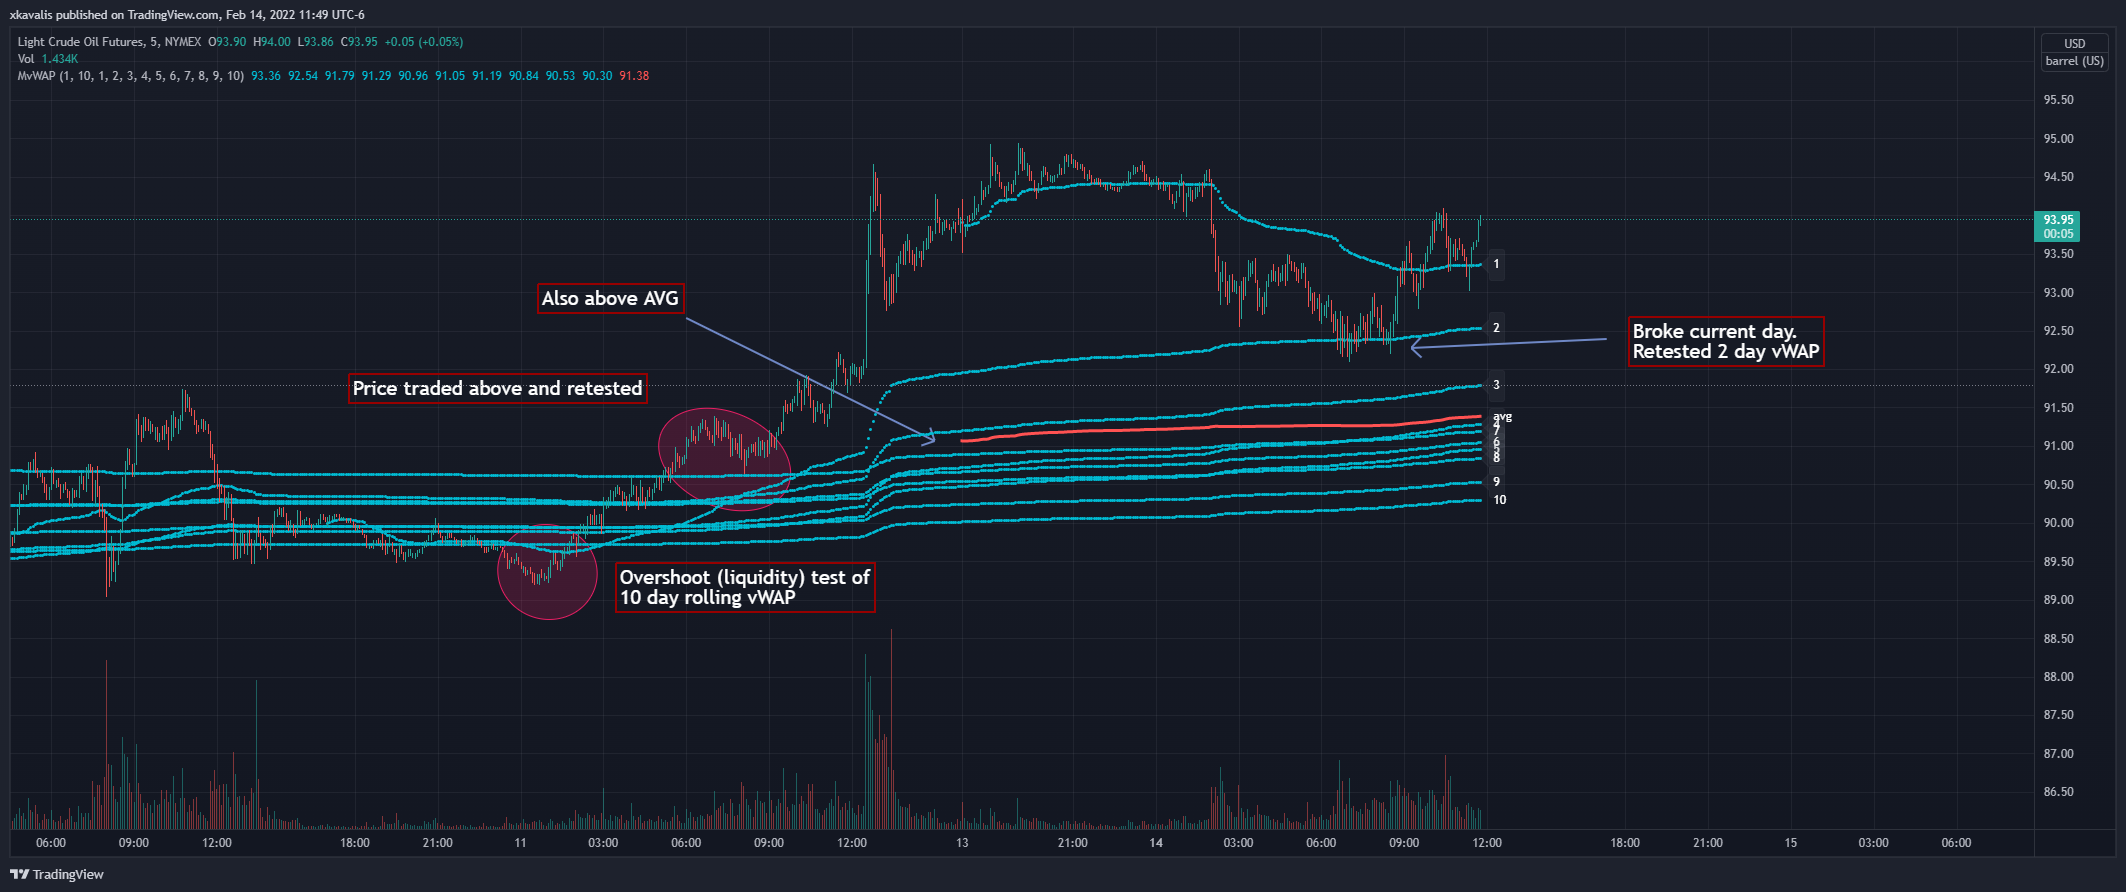
Another great way to use this indicator is to customize the values for rolling 7 days (5 days for cash markets).
To do this set values to: 7, 14, 21, 28, 35, 42, 49, 56, 63, 70
For instance, this BTC chart:
This chart provides a good example of what you’ll find when a chart is at a pivot point .
Price is checking in at the average to remain momentum long.
Upside longer term vWAP plots have been tested and had expected reaction.
Price is trading above the shorter term values.
Simple TA here will note if chart continues to trade above and takes out upper vWAPs long momentum is gaining ground.
On the downside if price trades thru the lower vWAP plots you would expect further downside. In this scenario you would be mindful to expect upside tests before (which could be good entry/reaction areas).
NQ example with 7 day values:
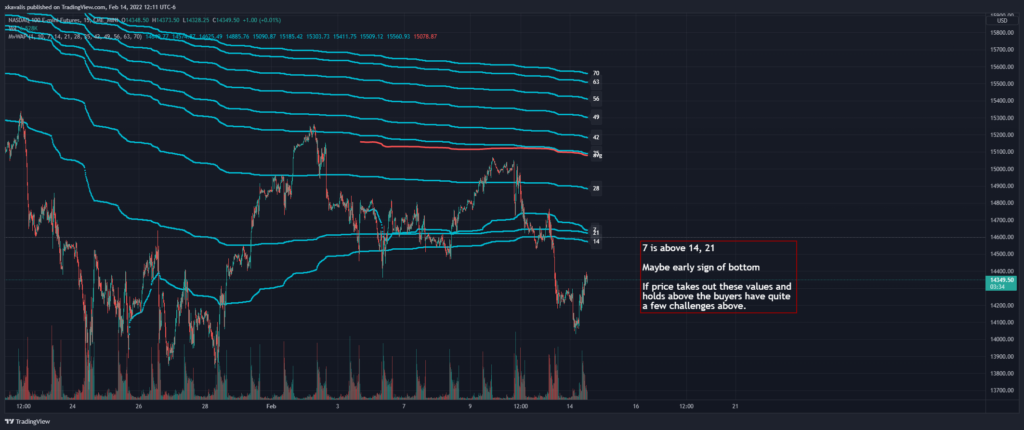
Overall chart is momentum short.
7 is above 14, 21
Maybe early sign of bottom.
If price takes out these values and holds above the buyers have quite a few challenges above.