
This page is my running analysis and updates on Bitcoin. The latest update is my view on BTC and driving what is driving my trade decisions.
November 2022 to Year End and Beyond
In this video we cover TA for Bitcoin going into the 2022 year end and beyond. First up I’ll share the link to the Bitcoin Analysis Series that covers both the 1st, 2nd, and the current 3rd crisis of Bitcoin, that can be found here:
https://rexdogtrading.com/ultimate-bitcoin-analysis/
In this video we cover a few interesting things about Bitcoin and where it’s at on the chart.
The first thing is BTC has left the 150D value channel to create what is most likely going to be a lower VC. I go over some key levels to watch and how it already tested a major inflection area.
We then dive into how BTC has given up every single aVWAP of significant highs and lows since the mass awareness.
There is one important development that might change the whole narrative on what Bitcoin does next… for those have been with me since the early days they will clearly note what we always look for in a sell off– stopping volume. We do see evidence of stopping volume. I actually show the most recent examples of what happened after we last saw stopping volume.
From there we go left of the chart and see if we can find clues where Bitcoin might be headed as we end the year 2022 and beyond. Factors that play a role is the previous VC, key levels, 4D chart, and momentum and bias indicators.
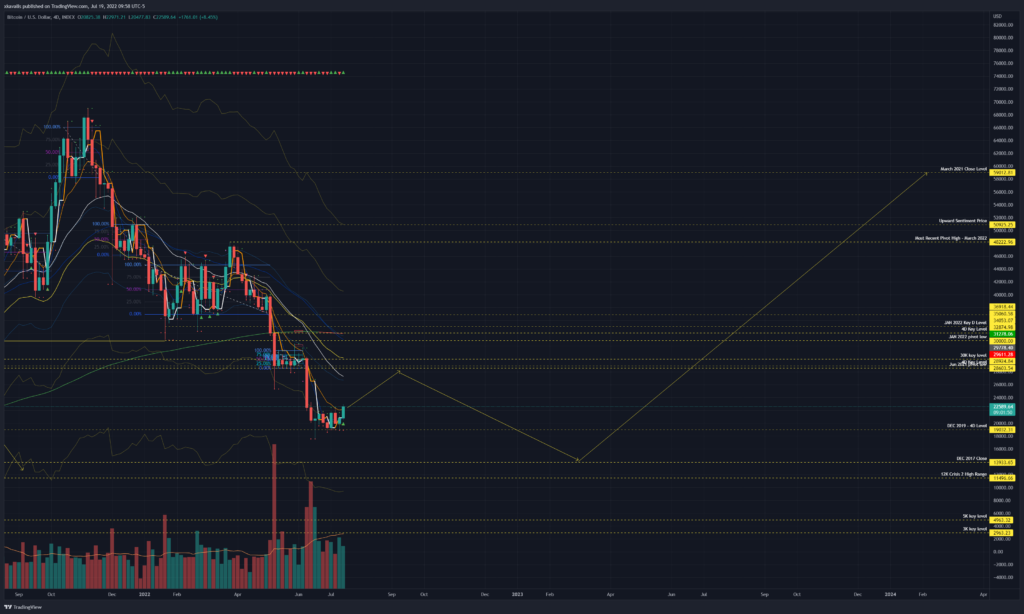
19 JULY 2022
4D chart. New channel created. Drop down to D to see RDA. If close above RDA then next channel above in play. Expect any push up to be sold off for 1 or 2 tests below. Tests below channel should be quick rejections if BTC intends to take out ATH.
2 JUNE 2022
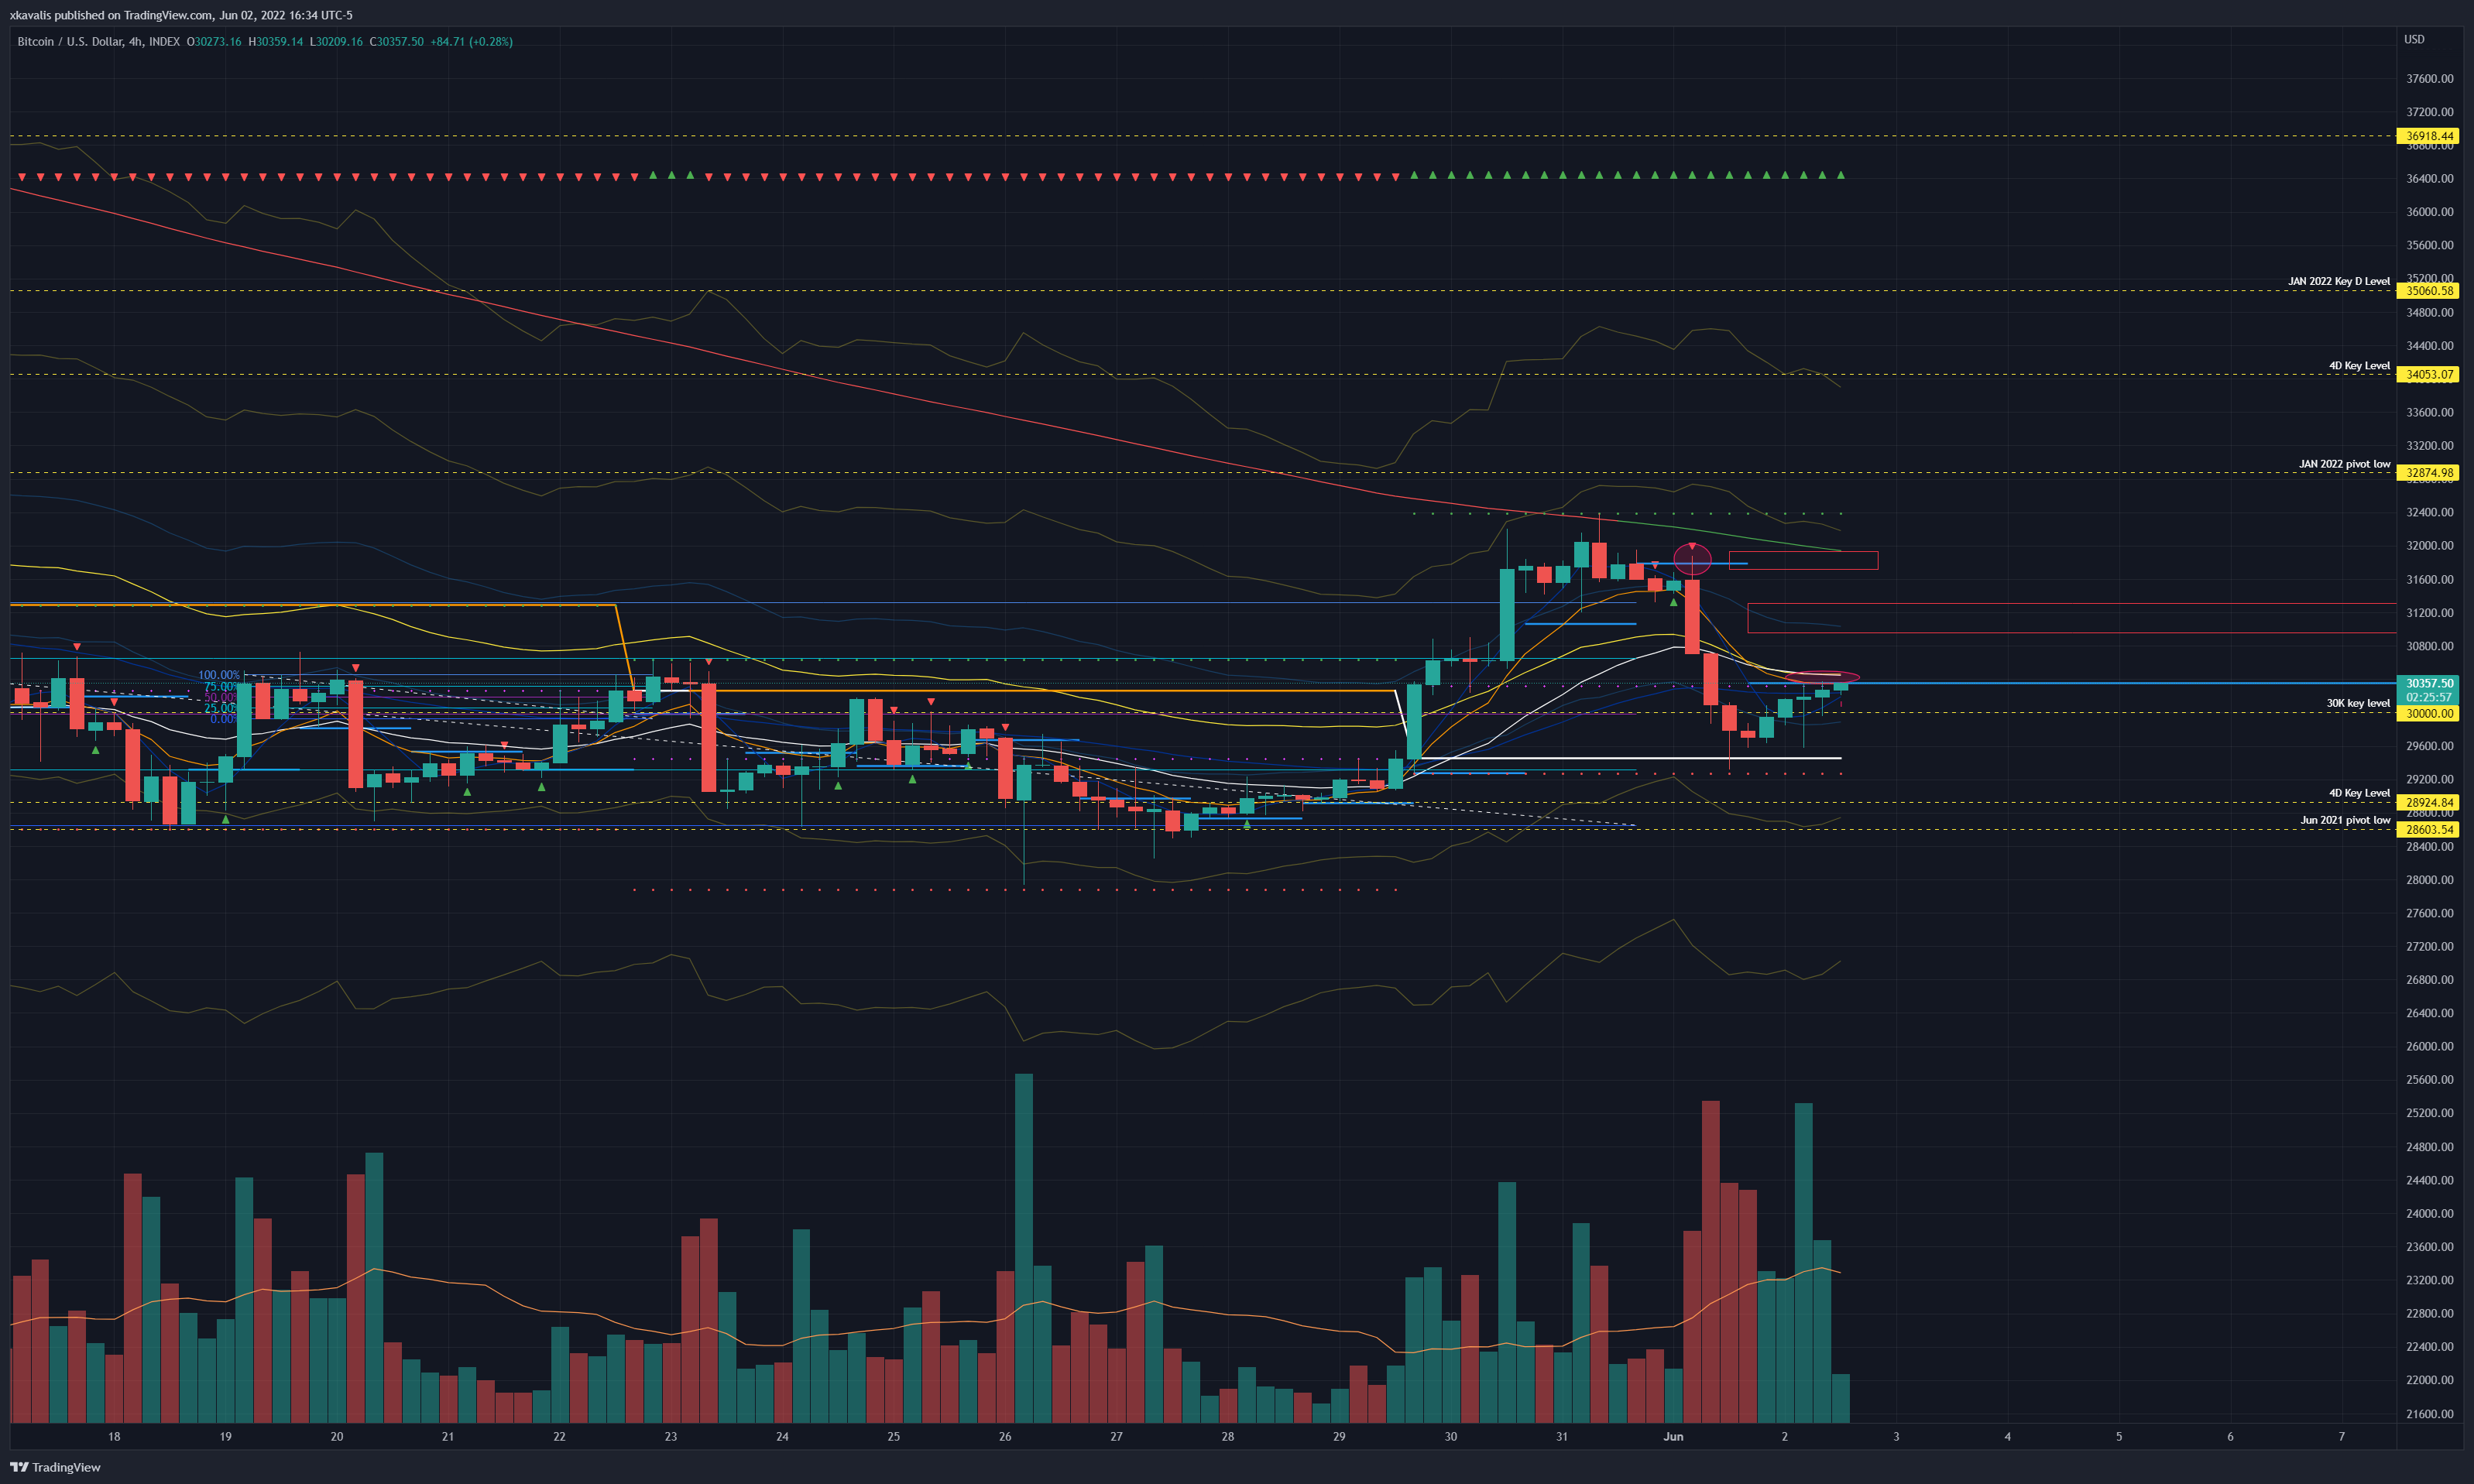
In this video I go over the current 10% or so value range Bitcoin is trading within for about 23 days. Cover the lower and upper excess. Provide to key areas to the upside to watch for lower time frame price action. Especially if the 60m turns bias and momentum long, it’s in a switch over state now. From there I share the 4D key lower level. Pretty binary and simple trade decisions here.
Below is the 240 view with upside reaction areas. Also key 4D levels to watch. With the weekly open holding the trade on BTC is pretty binary right now. It’s either the weekly holds and lower timeframes hold momentum long for upside tests or it hits a reaction area and sells off.
18 MAY 2022
A new value channel has developed over the last 7 days. BTC is trading within a 12% range or so since it now broke to trade around the 30K area.
One thing of note is the lower level aligns perfectly with the JUN 2021 pivot low. The only real positive you can add on the long side is this level has not had a close below. So it’s held so far.
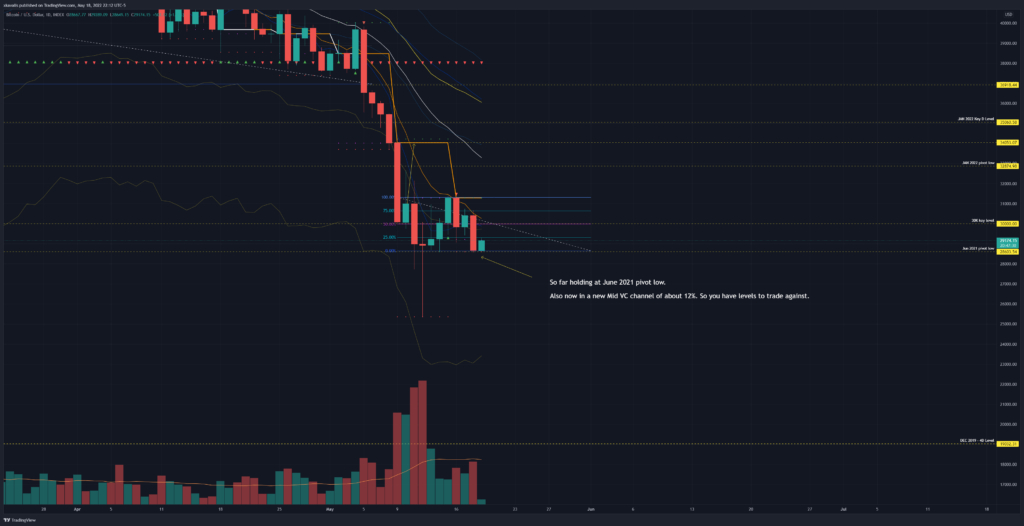
With this new VC being developed you do have levels and rules you can trade against. BTC is still momentum and bias short.
I anticipate a move upward to the momentum indicators and a failure form there. This chart outlines the key areas to watch for reactions:
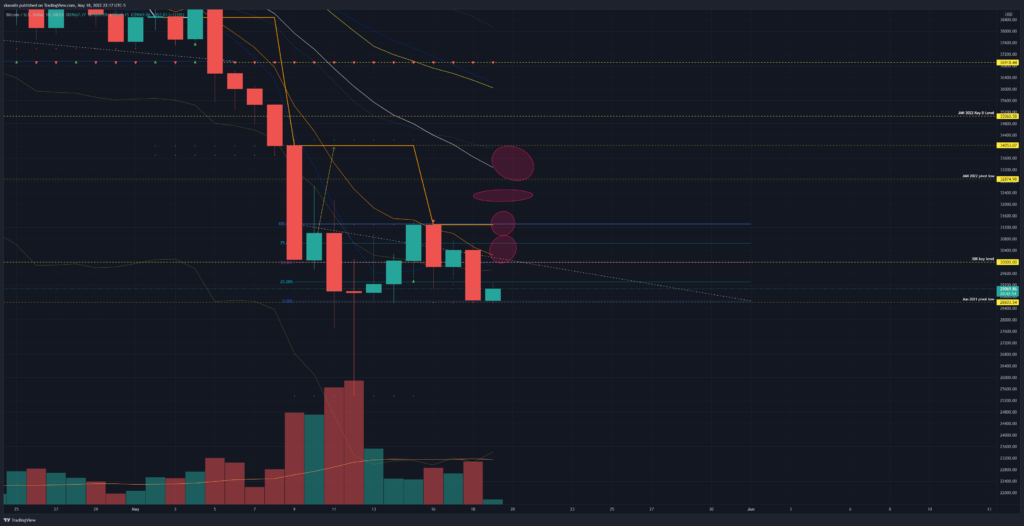
https://www.tradingview.com/x/GsWSkP0k/
09 MAY 2022
We first dive into the daily chart. Of concern there is BTC has now officially closed and traded out the VC it’s been within since JAN 2022. There is the key 30K level below. We then move onto the 4D chart and outline a key level to watch there. On the Weekly we have the Mixed 200 AVG sitting right around 24K– marking it good multi-week move target. A -50% sell off is well within the standard sell off ranges of Bitcoin. I’m preparing for further lows. I also look at the upside and share what to watch on the 60m and 240m charts.
03 MAY 2022
At this point using the 240m is probably key. Watching those levels. As you see in the chart below BTC is nearing the bottom of the long value channel it’s been in. So if it hits that area I’d expect an upside reaction. But the 60m, 240m charts are all bias and momentum short at this point:
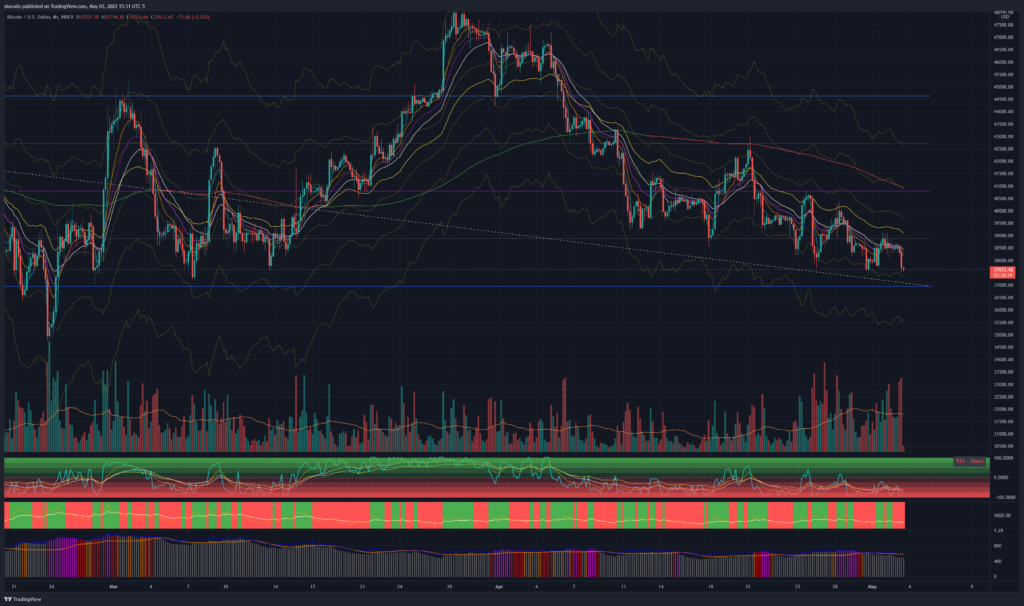
May 1st 2022 Update
Quick hits from video:
With the April close we take a quick look at the immediate downside and upside levels of concern on Bitcoin. Still trading within the value channel I’d expect an upside test then failure around our bias indicator the RexDog Average.
From there it’s watching the lower time frames and how they align with momentum and momentum checks.
Downside Levels:
- Immediate downside range is 35,100 to 37,000
- 37,000 is an important level because it is the bottom of the VC
- Next downside levels is 30,000 to 31,800.
- From there if all those break we might be heading into Bitcoin’s 3rd crisis
Upside Levels
- 1st 39,025
- 2nd 40,226
- 3rd (RDA) – 41,400
The best short entry at this point is between 41,500 and 43,400. Wide range but if BTC impulses up to this area I’d expect a failure. Watching on lower timeframes will reveal. You’d want to see a cascading failure from momentum long to momentum short from 5, 15, 30, and 60.
Before April 2022
Below are both tutorial videos but they cover my thoughts on and BTC price action and future price levels.