
Below are trading terms, acronyms, and shorthand I use in Discord, Trade Room Alpha, and in some of my training videos.
Some of these are general trading terms but most are specific to my trading system and how I trade and teach to trade the markets.
Table of Contents/Shortcuts
- Main Terms & Shorthand
- Why Do You Have So Many Different Terms? Is it Really Necessary?
- Time Short Hand
- Example – Bare Minimum with no Uppercase
- Example – Single Ticker Multi-Line Update Example
- NQ ST (Structure Long) Example
- RTH and ETH (Adopted from TradingView)
- What is a Reaction?
Main Terms & Shorthand
In alphabetical order. It’s easier to find instead of grouping by type or common elements.
- #
- 3Q – 3 Questions. Where is price coming from? Where does it want to go? How does it want to get there?
- A
- Algo – I use this shorthand to explain all possible participants in the market
- Algo switch – the chart I’m looking at let’s say the 5 minute is currently momentum long. An algo switch would be the that the chart switches to momentum short and then starts reliably starts staying in that momentum state on checks and key reaction areas.
- aVW = anchored vWAP
- Algo – I use this shorthand to explain all possible participants in the market
- B
- BDC – Break Down Candle
- BL – Bias Long (above the RDA)
- BS- Bias Short (below the RDA)
- BT = Big Tick
- BUC – Break Up Candle
- C
- C1, C2, C3, C4 – These are references to a single chart from the 4-Chart setup. C = Chart and the number represents the chart.
- D
- DO – Daily Open. Opening price for the day.
- F
- F = Fade
- FS = Fade Short
- FL = Fade Long
- FM = Fast Momentum, typically referring to the fast momentum indicators in the RDTS.
- I
- IC = Important Candle (same as pay attention candle)
- IA – Inflection Area
- K
- KL = Key Level – such as weekly open, daily close, etc.
- L
- LC = level check
- LTF = Lower Time Frame . For instance, I share a chart with a 60m signal area and say this area looks good if LTF holds and builds structure. LTF in this scenario would most likely be 5m, 1m, or 15m.
- M
- M = Momentum
- MC = Momentum Check
- MIA – Minor Inflection Area
- ML = Momentum Long
- MOM = Momentum
- MS = Momentum Short
- N
- NMS – Negative Mental State
- O
- OR = Opening Range
- OR 50 = Opening Range 50%
- P
- PAC = Pay Attention Candle
- PMS – Positive Mental State
- R
- RH – Recent High
- RL – Recent low
- RDA = RexDog Average
- RDS = RexDog System
- RDTS = RexDog Trading System
- S
- System – RexDog trading system
- SM = Slow Momentum or in reference to the slow momentum indicator in the RDTS.
- ST = Small Tick
- T
- TOD – Time of Day. Often I use this for the afternoon session. I’ll say something along the lines of “I’m fading the high given TOD”. It’s 11:45 AM my time – 12:45 NY market time. The probability the market is going to break the high is low during this liquidity time (afternoon). So sell the false breakout.
- V
- VW or vW = vWAP
- W
- WO – Weekly Open. Opening price of the week.
Time Shorthand
Note: sometimes I don’t add the “m” to the timeframe. Examples of updates are below definitions.
- 1m = 1 minute
- 5m= 5 minute
- 15m = 15 minute
- 60m = 60 minute/1 hour timeframe – the golden timeframe
- 240m – 240 minute or 4 hour
- D or d – daily chart
- W o w – weekly chart
- 4D – 4 day chart
- M – monthly chart
Why Do You Have So Many Different Trading Terms? Is it Really Necessary?
The #1 thing you need to know about me as a trader, mentor, and why I believe I am one of the outliers in trading success. Not an ego just well how it is:
I obsess over the details.
I go into much more detail on this post on Why I Have So Many Different Terms.
Putting It All Together – Example Updates
In this section, I’ll provide a few examples of updates that I share in Discord and Trade Room Alpha.
Bare Minimum – No Uppercase
This is an example update. Generally, if you see this type of update with no upper case I don’t have time but thought it worth sharing. I’m also testing some automated updates using StreamDeck.
TICKER – 240 lc fl reaction area

Translation
The 240-minute chart (4 hour) is approaching or at a level check area where there is a probability of reaction. That reaction is probable a fade long trade.
- Then usually a chart, but not always
- Sometimes that chart is not of the same timeframe I referenced
- Why is that?
- The larger timeframe is the signal. I’m using the lower timeframe to confirm if there is an opportunity in the trade
- I generally will say share the chart timeframe but if I don’t you should be adept at being able to understand what is being communicated. I know it takes a bit of time but once you get used to it you’ll know what the next steps are
- Sometimes I just don’t have time or use upper case. Yes, that update would look better like this:
- 240m LC FL reaction area
Single Ticker Multi-Line Update Example
Here’s what it will look like in discord:
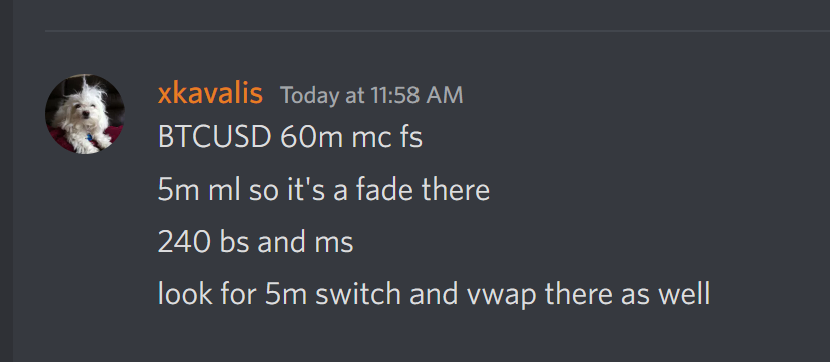
Translation
BTCUSD 60 minute chart is approaching or at momentum check for a momentum short trade.
The 5m chart is momentum long so on that chart this trade is a fade trade.
The 240m (4-hour) chart is bias short (below the RDA) and momentum short (good as the larger timeframe supports the trade somewhat)
Watch for the 5m to fail and switch to momentum short.
The vWAP is in this general area so if price tests this and fails this is another possible sign that short trade is the right direction to trade.
NQ ST (Structure Long) Example

Translation:
NQ small tick chart is showing a structure pattern for a long trade. Expansive detail…
NQ small tick chart showing a structure pattern for a fade long trade. The small tick chart or possibly another chart we use in the system is controlling or in a momentum short state. The trade that is possibly unfolding is a long trade that is ultimately a fade but is showing early signs of a possible bottom on the small tick. Trade the structure fade trade entry rules if you see the same thing developing.
What does that mean?
Members who have gone thru my training will clearly know what this signal means and looks like.
RTH and ETH (Adopted from TradingView)
Trading view recently released an option that is great for the futures market. At the bottom right of a futures chart (below the daily timeframe) you’ll see an option for:
I’ve decided that I will adopt this shorthand in Trade Room Alpha for when we discuss the futures market.
- ETH (Electronic Trading Hours) – The almost 24 hour futures market and charts will be referred to as the ETH
- RTH (Regular Trading Hours) – The index or cash chart (NQ RTH) will be referred to as the RTH
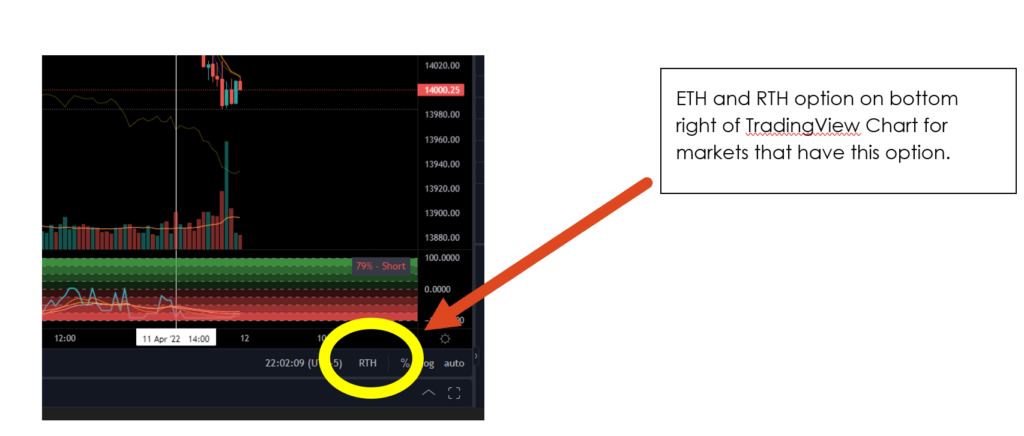
If you have RTH on for instance in the evening on the NQ!! Ticker you’ll see no action—that is because the regular market is not open. So you’re seeing the previous day’s action and close. That’s where the chart ends.
If you switch to ETH you’ll see the overnight current price action (if you have a data subscription, otherwise I think it’s delayed).
What is a Reaction?
Here’s something most don’t understand about my trading system.
What I trade is an always in trading system that reverse engineers’ momentum. If the market is moving in either direction I want to participate.
It provides where to look for high probability reaction areas on a chart.
The system is good at defining both take profit areas and entry areas.
At any given time you should be able to look at a chart on any timeframe and see the highest probable long trade and the highest probable short trade. Of course, there are any number of trades in between but the most basic bring it down to the bare bones– this is what I trade. The highest probable trade given where the market is and given the momentum situation.
Here’s the most important concept on reaction areas:
- Those areas are high probable areas but not guaranteed
- Each reaction is a self-contained reaction event that is unique to that moment in time and area in the chart
- There is no template reaction and there never will or can be
- Those that are looking for a simple template are seeking comfort
- There are expectations and more than typical behaviors. You can take a 2 nearly identical reaction areas on the same ticker and one will be a 1% reaction and another a 7%. If you entered both trades how you manage the trade and the reaction is key. Not the fact there was a reaction.
For me, using these reaction areas allows for me to execute a trade system that doesn’t have red days– it’s really comes down to how much of a green day.
I know this goes against what you hear from other traders, read in books, hear on Twitter, etc. Most traders self limit themselves to the opportunities the market presents.
I’ll ask this simple question.
If you look at the market and see on some days it goes up and some days it goes down. Why wouldn’t you create a system where you could try to figure out which way it’s going to go before it does?
Well sure, that’s what all traders are trying to do.
I don’t know what other traders, gurus, furus, authors, et all are doing out there but I chalk it up to they aren’t as dedicated, obsessed, interested, passionate, inquisitive, and aggressive as I am about taking capital from the market no matter what time of the day it is.
There are also so many ways to successfully trade. It’s not always the system– it’s the mindset and psychology. Read about the turtle traders. The system worked it’s just finding those who could execute the system was the biggest challenge.